Firm Gas in ERCOT Is a Location Lottery
For hyperscalers siting loads and infra funds valuing gas platforms: the firm gas you can actually buy is concentrated in West Texas and nearly absent from the DFW load pocket.
For hyperscalers · For infra funds · ercot · gas · interconnection · siting · zones
Tafel Power · July 10, 2026 · 4 min read
An earlier Tafel Power Brief showed that ERCOT's 69.7 GW gas queue narrows to 8.8 GW of firm gas that a large load can actually contract this cycle: signed interconnection agreement, in service by 2028, and merchant rather than public-authority self-build. That number answered how much. It did not answer where. The where turns out to matter more.
The right question is not whether there is firm gas in ERCOT. It is whether there is firm gas behind your zone. ERCOT is one market on paper, but it is divided by internal transmission constraints, so firm capacity in one zone does not always deliver to a load in another without congestion and basis risk. When you map the 8.8 GW, the supply and the demand are not in the same place.
Where the deliverable gas actually sits
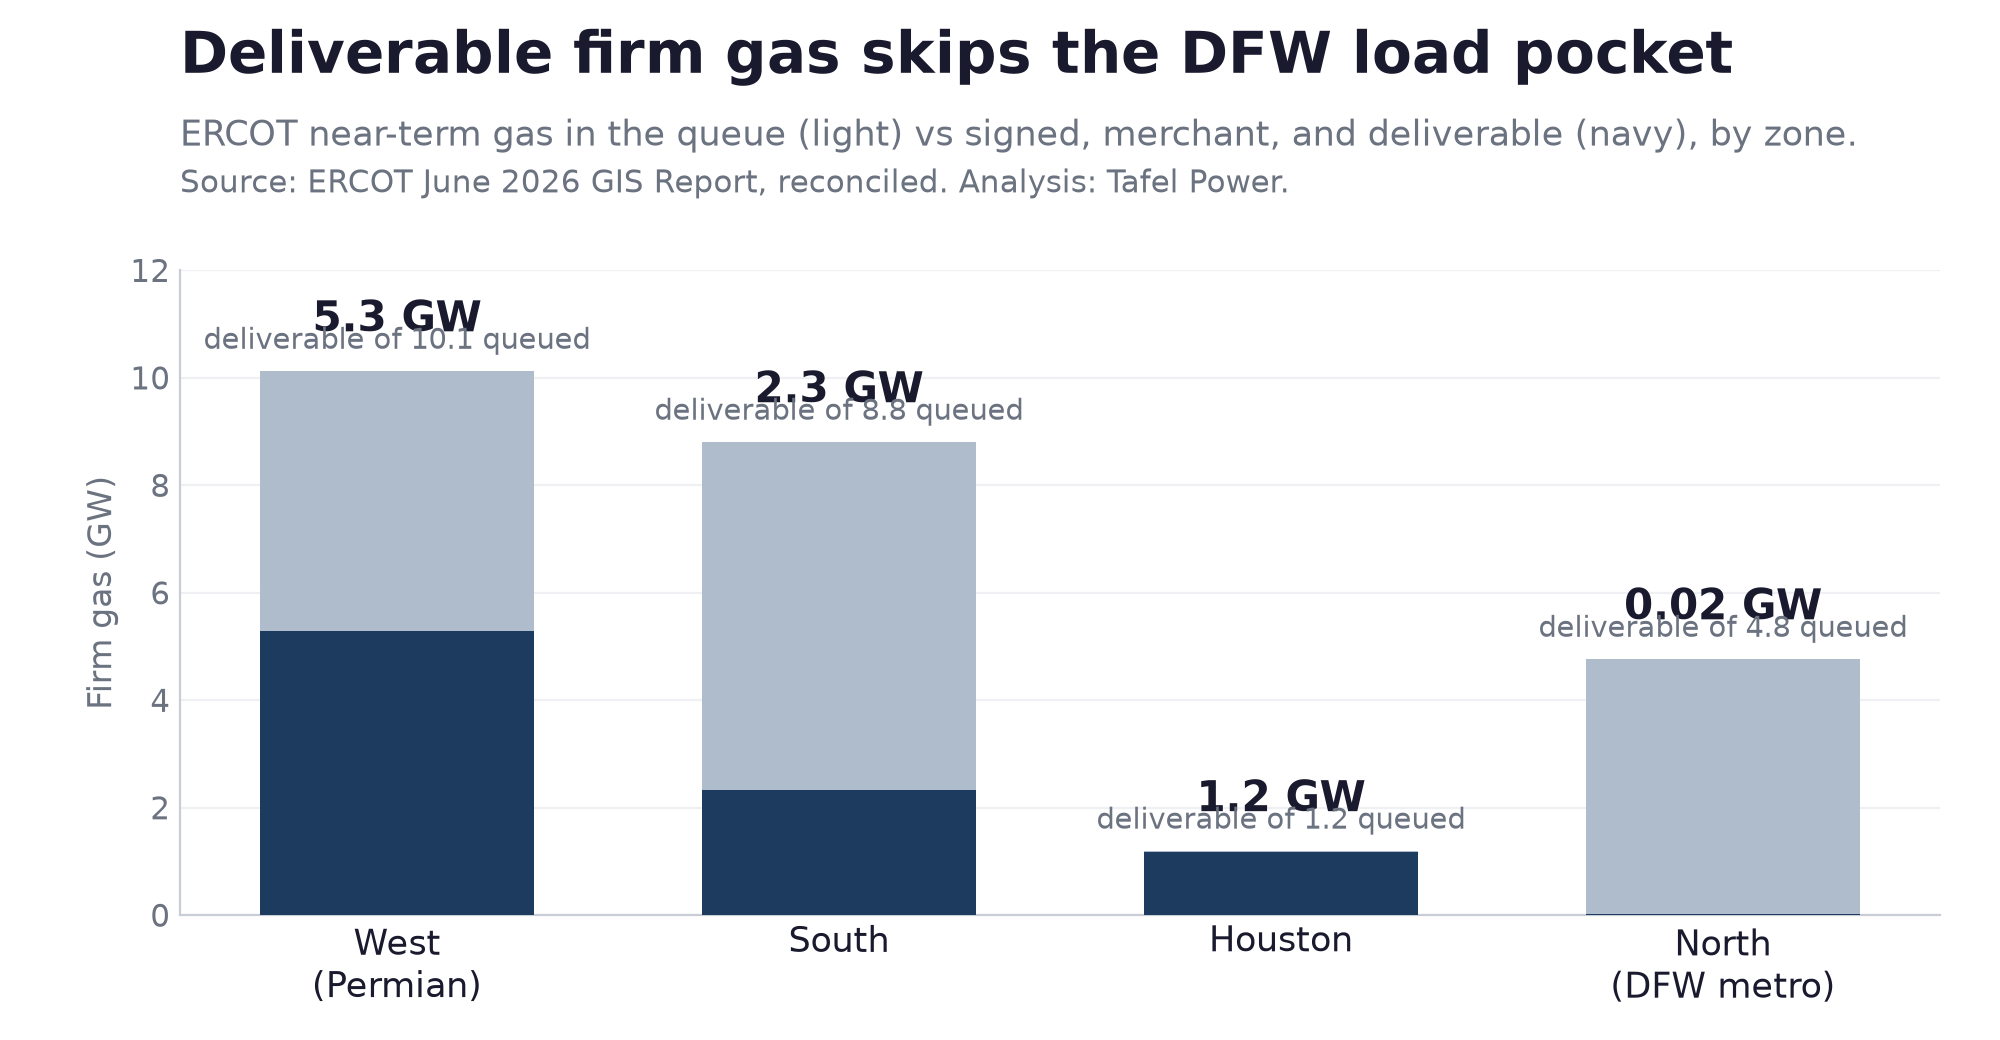
The 8.8 GW breaks down by ERCOT zone as follows. West Texas, the Permian corridor, holds 5.3 GW, about 60 percent of the deliverable set. South holds 2.3 GW. Houston holds 1.2 GW. The North zone, the Dallas-Fort Worth metro, holds 0.02 GW, a single 21 MW repowering of an existing plant, not new-build firm capacity.
That is the whole story in one line. The zone with the most concentrated data-center interest has essentially no firm gas that has cleared an interconnection agreement and can be built this cycle.
North looks supplied until you check the interconnection agreements
The trap is that North does not look empty in the raw queue. It shows 4.8 GW of near-term gas across fifteen projects with a 2026 to 2028 in-service date. A developer or an offtaker scanning the queue for capacity near DFW would see plenty of it.
Almost none of it has signed. Of that 4.8 GW of near-term North gas, 0.02 GW holds a signed interconnection agreement. The conversion rate from near-term queue to deliverable is 0.4 percent. Houston is the opposite: 1.2 GW near-term, 1.17 GW signed, a conversion rate near 98 percent. West converts about half of its near-term queue, and South about a quarter.
So the queue by zone is not a supply map. It is a map of where developers have filed intentions. The signed set is a map of where firm gas will actually arrive, and the two maps disagree most exactly where the load wants to be.
What this changes for each buyer
Hyperscaler energy leads siting a load. Site selection and power procurement are the same decision, not two. A site in the North load pocket carries almost no behind-the-zone firm gas that can be contracted before 2029. That does not make North impossible, but it converts the power question from contracting to transmission: you are betting on West and South generation reaching you, which is a basis and congestion exposure, not a signed offtake. West Texas is where the deliverable firm gas is, and the siting decision should weigh that against water, land, and latency.
Infra funds underwriting a gas platform. Zone concentration is concentration risk. Sixty percent of the deliverable set sits in West Texas, much of it exposed to the same Permian gas basis and the same transmission paths out of the region. A platform valued on ERCOT-wide firm-gas scarcity is really valued on a handful of West Texas nodes. Diligence the node, the transmission out of the zone, and the basis, not the ERCOT aggregate.
Developers holding positions. A signed interconnection agreement in the North zone is a genuinely scarce asset, far scarcer than the raw North queue suggests, because the rest of that queue has not cleared the same bar. The value of a committed North position is set by the near-absence of competing committed supply, not by the crowded list of unsigned filings around it.
Methodology
Figures are drawn from the ERCOT June 2026 GIS Report (Large and Small Gen, projects with a Full Interconnection Study requested) and reconciled against that immutable source file before publication. Zone is the report's CDR zone. "Signed IA" reflects the report's IA Signed field, corroborated by the GIM Study Phase field; where the two disagree, the more conservative non-signed reading is used. Near-term means a developer-requested in-service date of 2026 to 2028, which skews optimistic and should be read as an upper bound. Merchant excludes cooperatives, municipal utilities, and public authorities. Several of the largest deliverable projects are in Texas Energy Fund due diligence, which carries its own financing conditions a buyer should confirm before treating a project as freely contractable. Figures reflect the June 2026 snapshot and may have changed since. Status is current as of July 8, 2026.
Because the 8.8 GW figure is derived from multiple filters applied to ERCOT GIS fields, it should be read as Tafel Power's filtered estimate of merchant, signed, near-term gas capacity, not as an ERCOT-published category.
All data compiled by Tafel Power from public sources. Framing informed by the firm's transaction advisory work in ERCOT and cross-ISO markets.
For discussions on ERCOT and cross-ISO power transactions, large-load diligence, or AI infrastructure power strategy: kris@tafelpower.com
More from Insights
The ERCOT Firm-Gas Overlap Problem
For hyperscalers · For infra funds · ercot · gas · interconnection
July 9, 2026 · 3 min read
For hyperscalers pricing offtakes and infra funds valuing platforms: the ERCOT firm-gas pool that is both deliverable and committed is smaller than either filter suggests.
Batch Zero's Interim Framework and the $50,000 per MW Default
For developers · ercot · batch-zero · puct
July 8, 2026 · 2 min read
For developers with queue positions and offtakers structuring around them: what the new $50,000 per MW default financial security means for deal math.